Description
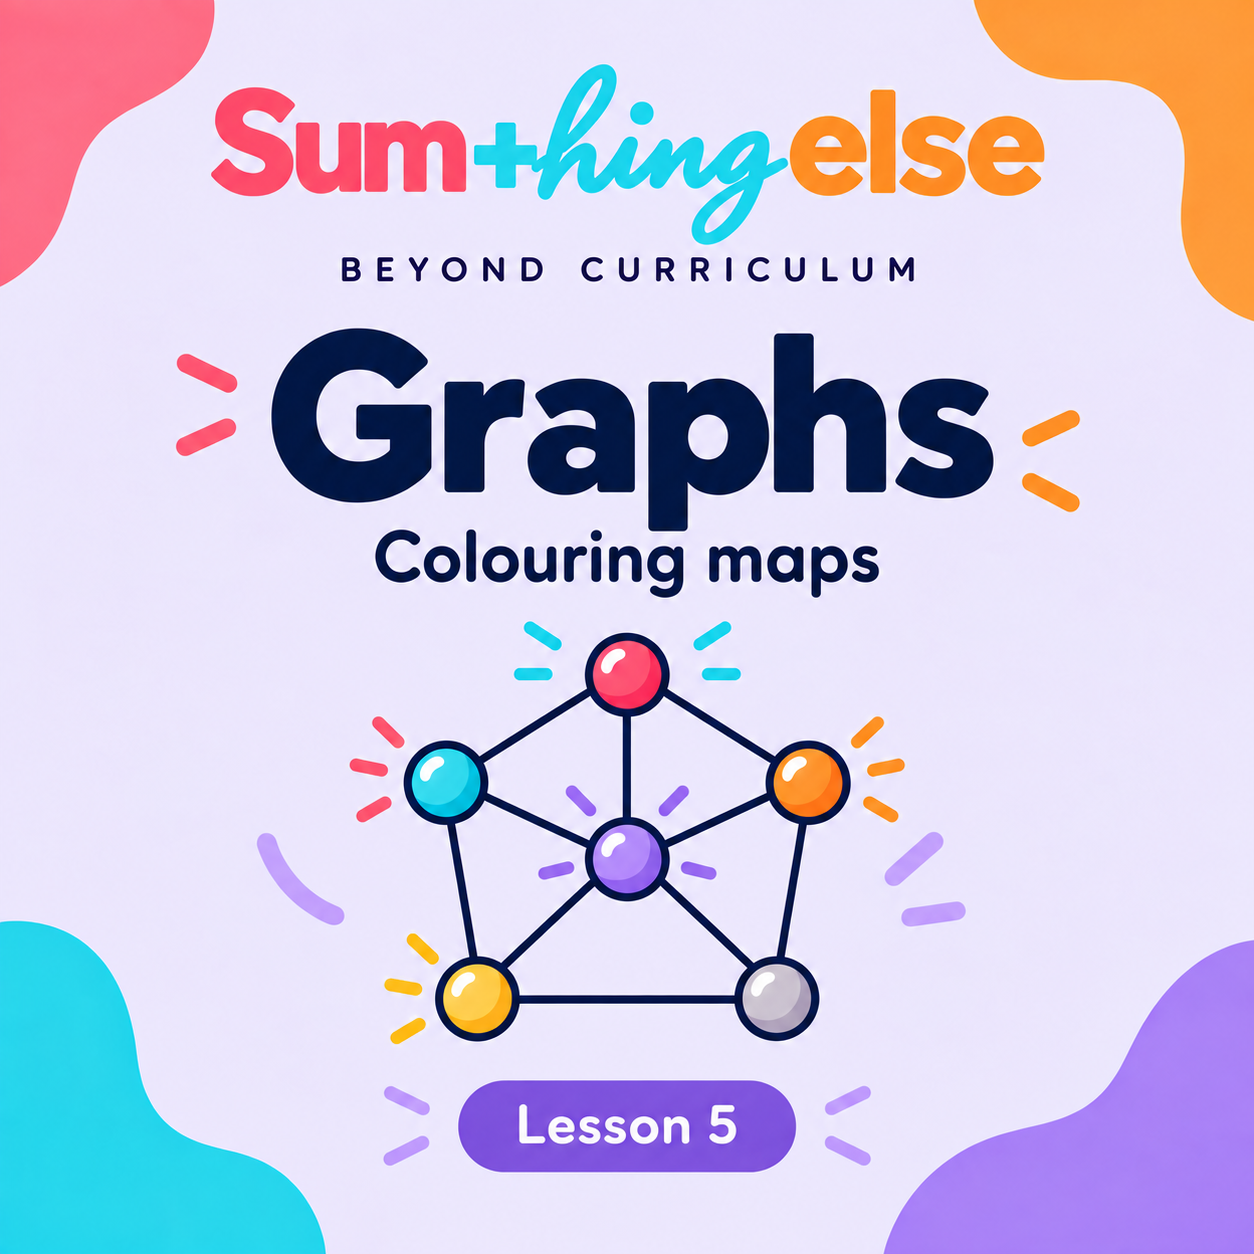
Discover the mathematics hidden inside an ordinary coloured map.
Learners replace each region with a vertex and join vertices whose regions share a border. This transforms a visual map-colouring problem into a graph-colouring problem that can be explored systematically.
This lesson introduces:
- turning a map into an adjacency graph;
- proper colourings;
- the chromatic number of a graph;
- finding colourings that use as few colours as possible;
- explaining why fewer colours cannot work;
- the statement and history of the Four Colour Theorem;
- applications such as timetable and scheduling problems.
The download includes the main lesson and a supplementary examples booklet with further problems, answer checks and model solutions.
Suitable for learners aged 10 and over. No previous experience of graph colouring is required.
This is Lesson 5 of the six-part Beyond Curriculum: Graphs course.
☕ Free to download
This resource is completely free. If you find it useful and would like to support the creation of more free mathematics resources, you can support Sumthing Else on Ko-fi .
Reviews
There are no reviews yet.